
Finding x-intercepts and y-intercepts
The intercepts of a graph are points at which the graph crosses the axes. The x-intercept is the point at which the graph crosses the x-axis. At this point, the y-coordinate is zero. The y-intercept is the point at which the graph crosses the y-axis. At this point, the x-coordinate is zero. To determine the x-intercept, we set y equal to zero and solve for x. Similarly, to determine the y-intercept, we set x equal to zero and solve for y. For example, lets find the intercepts of the equation . To find the x-intercept, set .
To find the y-intercept, set .
We can confirm that our results make sense by observing a graph of the equation as in Figure 10. Notice that the graph crosses the axes where we predicted it would.
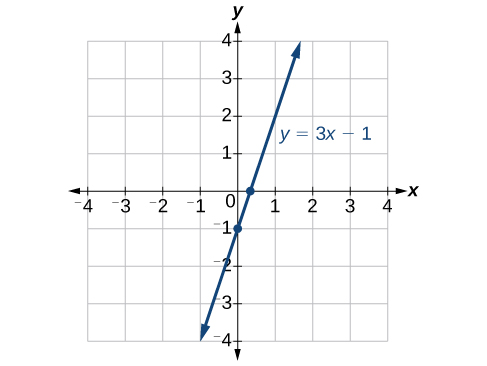 Figure 12
How To: Given an equation, find the intercepts.
- Find the x-intercept by setting and solving for .
- Find the y-intercept by setting and solving for .
Example 4: Finding the Intercepts of the Given Equation
Find the intercepts of the equation . Then sketch the graph using only the intercepts.Solution
Set to find the x-intercept.
Set to find the y-intercept.
Plot both points, and draw a line passing through them as in Figure 11.
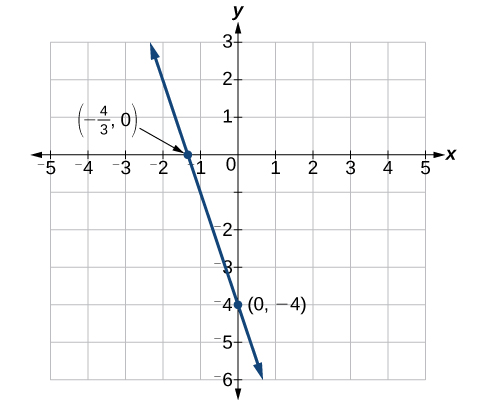 Figure 13