Solutions
Solutions to Try Its
1. 2. 3. 4. 5. 6. 7. 8. 9. 10. or ; in interval notation, this would be .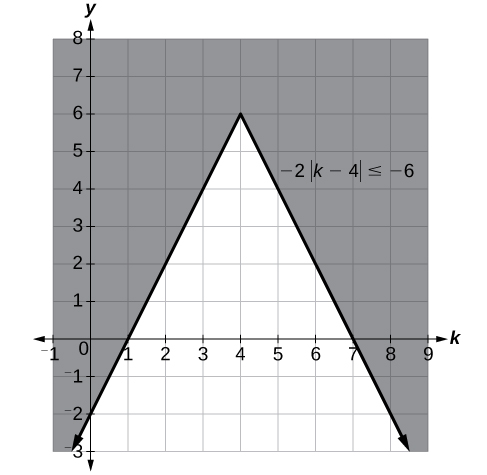
Solutions to Odd-Numbered Exercises
1. When we divide both sides by a negative it changes the sign of both sides so the sense of the inequality sign changes. 3. 5. We start by finding the x-intercept, or where the function = 0. Once we have that point, which is , we graph to the right the straight line graph , and then when we draw it to the left we plot positive y values, taking the absolute value of them. 7. 9. 11. 13. 15. All real numbers 17. 19. 21. No solution 23. 25. 27. 29. 31. 33.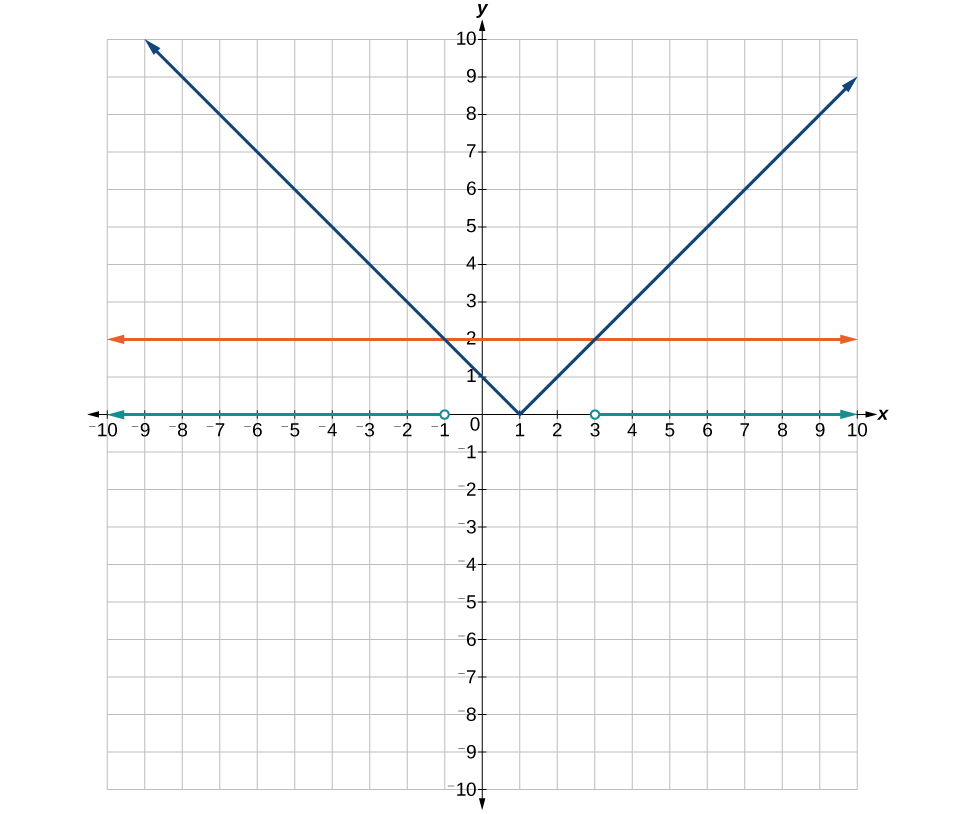 35.
35.
 37. It is never less than zero. No solution.
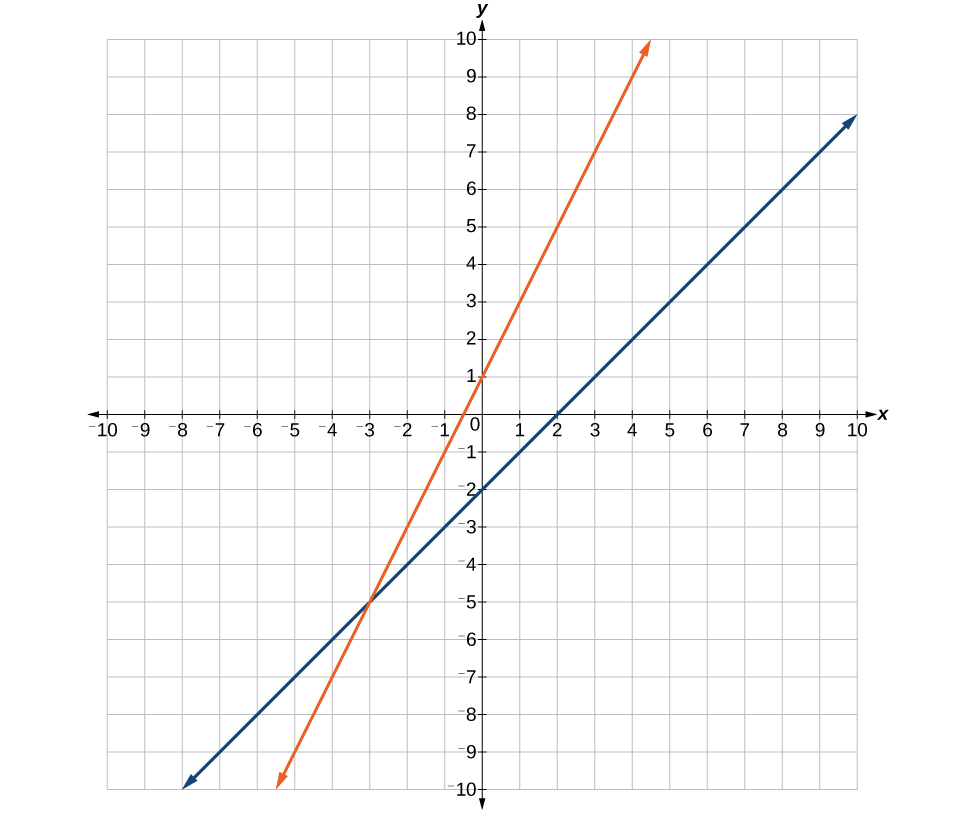
 39. Where the blue line is above the orange line; point of intersection is .
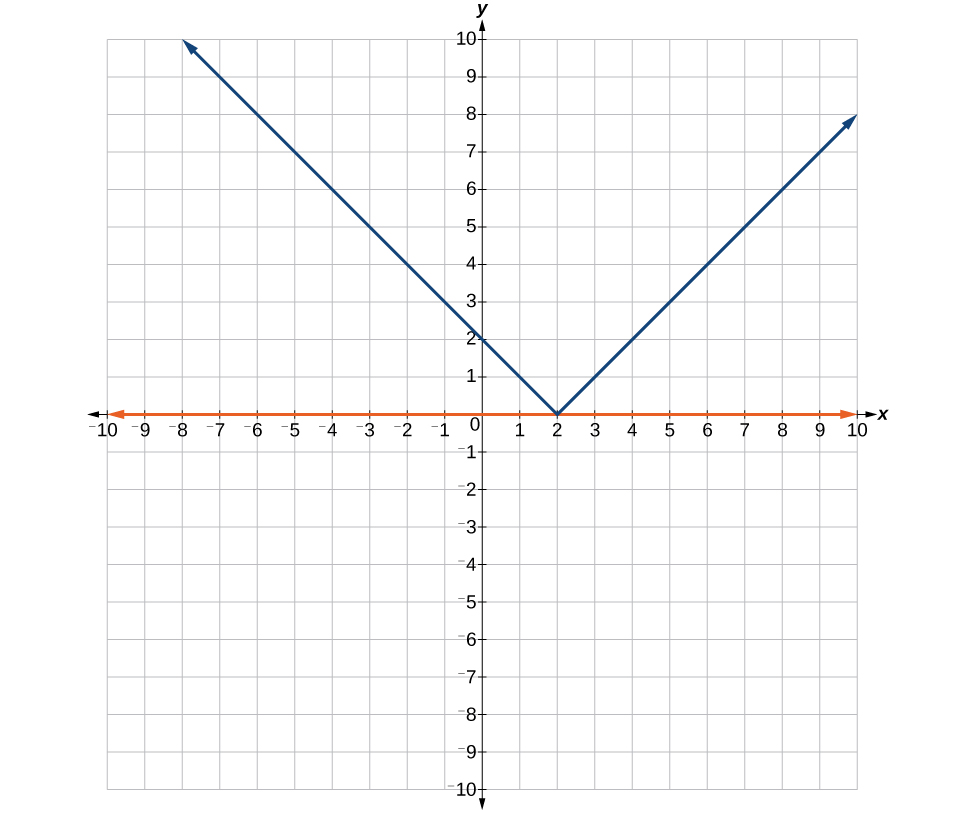
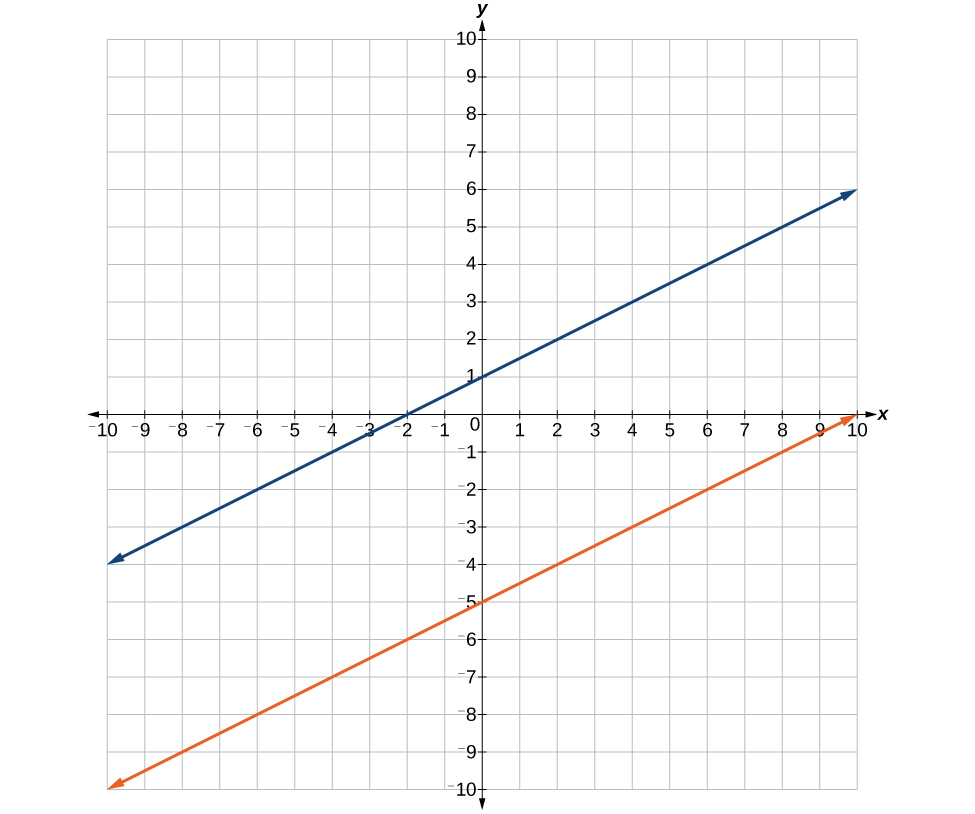
 41. Where the blue line is above the orange line; always. All real numbers.
 43.
45.
47.
49.
51.
53.
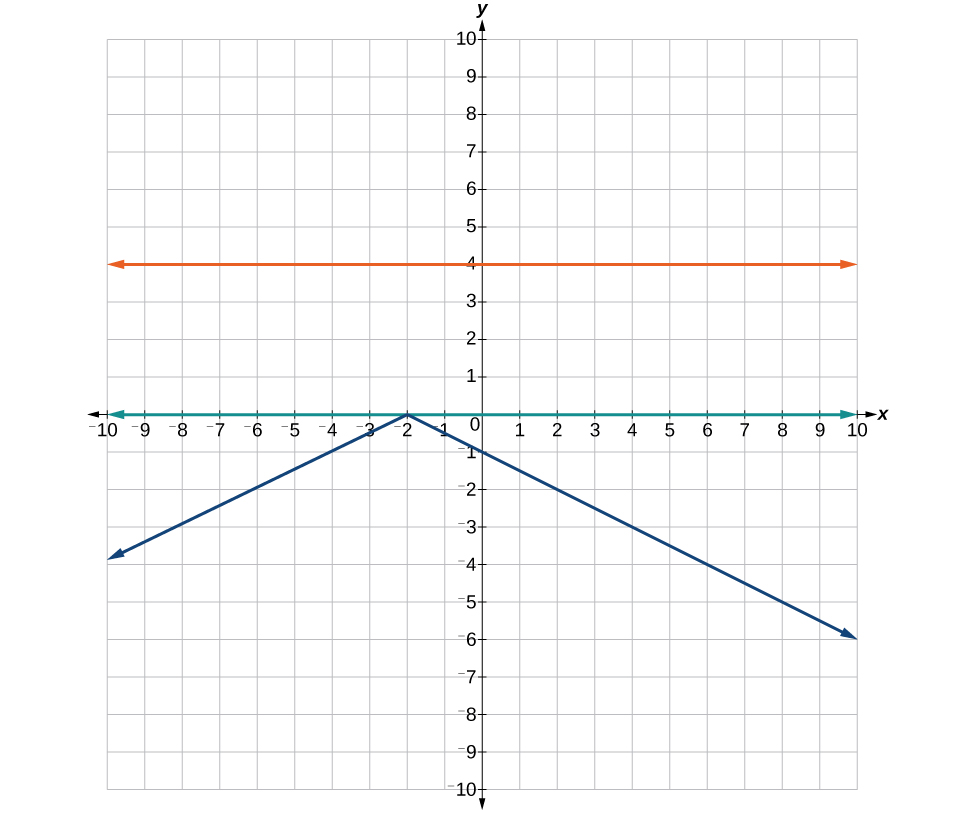
55. Where the blue is below the orange; always. All real numbers. .
43.
45.
47.
49.
51.
53.
55. Where the blue is below the orange; always. All real numbers. .
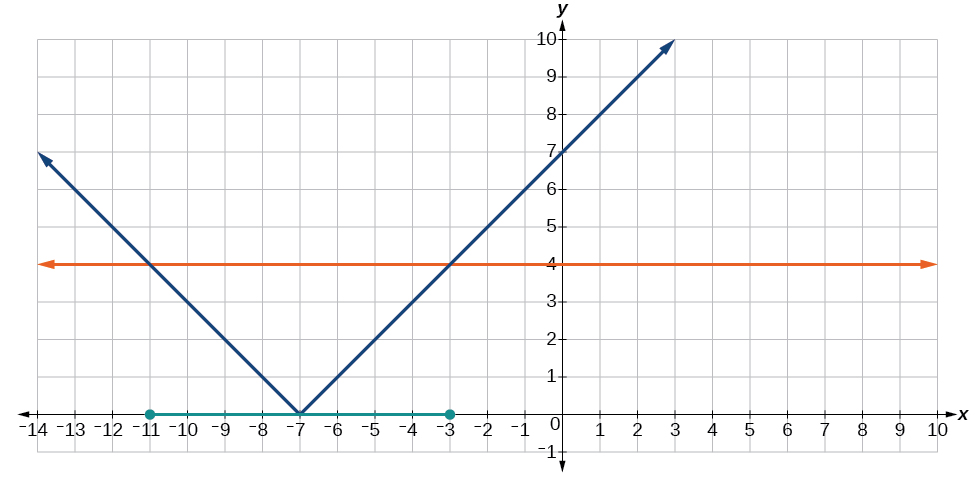
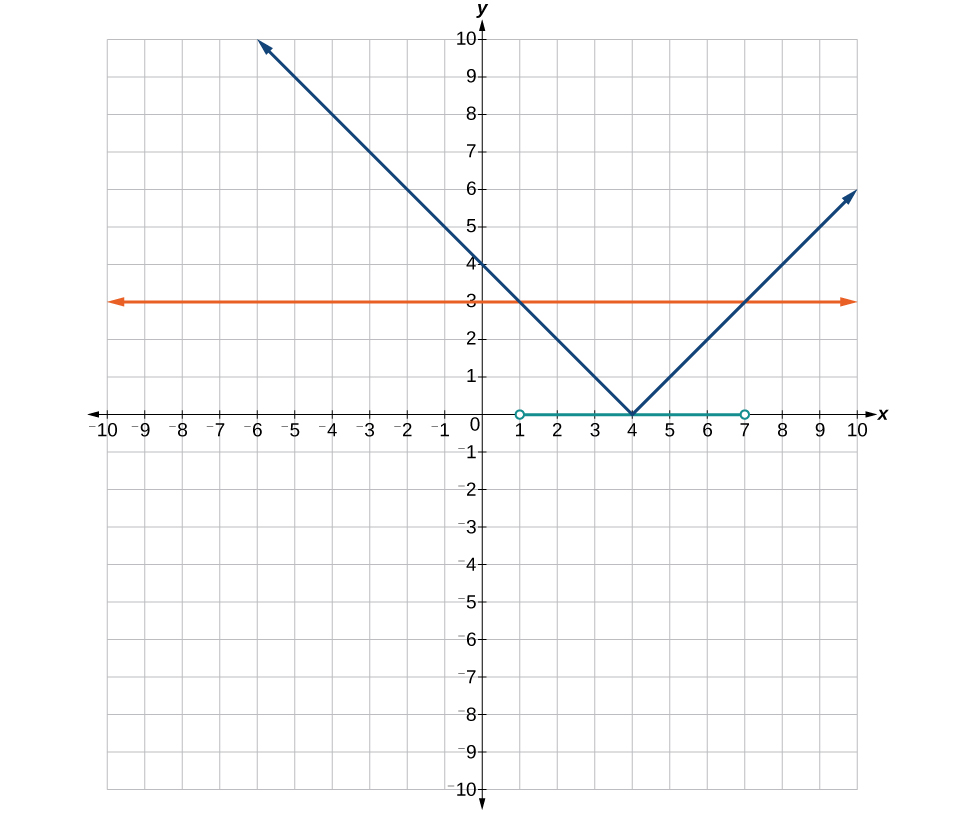
 57. Where the blue is below the orange; .
 59.
61.
63.
59.
61.
63.
