
Graphing Systems
Learning Outcomes
- Graph systems of equations
Graph a system of linear equations
There are multiple methods of solving systems of linear equations. For a system of linear equations in two variables, we can determine both the type of system and the solution by graphing the system of equations on the same set of axes. We will practice graphing two equations on the same set of axes, and then we will explore the different considerations you need to make when graphing two linear inequalities on the same set of axes. The same techniques are used to graph a system of linear equations as you have used to graph single linear equations. We can use tables of values, slope and -intercept, or - and -intercepts to graph both lines on the same set of axes.Example
Solve the following system of equations by graphing. Identify the type of system.
Answer: Solve the first equation for .
Solve the second equation for .
Graph both equations on the same set of axes as seen below.
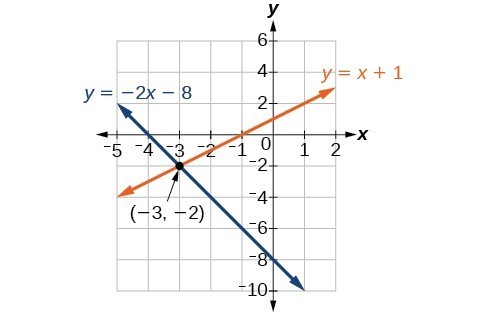 The lines appear to intersect at the point . We can check to make sure that this is the solution to the system by substituting the ordered pair into both equations
The solution to the system is the ordered pair , so the system is independent.
Try It
[ohm_question]38339[/ohm_question]In the following example, you will be given a system to graph that consists of two parallel lines.
Example
Graph the system using the slopes and -intercepts of the lines.Answer:
First, graph using the slope and the -intercept
 Next, add using the slope , and the -intercept
 Notice how these are parallel lines, and they don't cross. In the previous section, we discussed how there are no solutions to a system of equations that are parallel lines. We classified this type of system as an inconsistent system.
Example
Graph the system using the x - and y-intercepts.Answer:
First, find the - and - intercepts of
The -intercept will have a value of for , so substitute into the equation, and isolate the variable .
The -intercept of is .
The -intercept is easier to find since this equation is in slope-intercept form. The -intercept is .
Now we can plot using the intercepts
 Now find the intercepts of
Substitute in to the equation to find the -intercept.
The -intercept of is .
Now substitute into the equation to find the y-intercept.
The -intercept of is .
WAIT, these are the same intercepts as ! In fact, and are really the same equation, expressed in different ways. If you were to write them both in slope-intercept form you would see that they are the same equation.
When you graph them, they are the same line. In the previous section, we learned that systems with two of the same equations in them have an infinite number of solutions and are classified as a dependent system.
Now find the intercepts of
Substitute in to the equation to find the -intercept.
The -intercept of is .
Now substitute into the equation to find the y-intercept.
The -intercept of is .
WAIT, these are the same intercepts as ! In fact, and are really the same equation, expressed in different ways. If you were to write them both in slope-intercept form you would see that they are the same equation.
When you graph them, they are the same line. In the previous section, we learned that systems with two of the same equations in them have an infinite number of solutions and are classified as a dependent system.
