
Characteristics of Linear Functions
Learning Outcomes
- Identify important features of graphs of linear functions
We previously learned how to calculate the slope given input and output values. Given two values for the input, and , and two corresponding values for the output, and —which can be represented by a set of points, and —we can calculate the slope , as follows
where is the vertical displacement and is the horizontal displacement. In function notation, the corresponding values for the outputs and for the function are and , so when using function notation we equivalently write
The slope of a function is calculated by the change in divided by the change in . It does not matter which coordinate is used as the and which is the , as long as each calculation is started with the elements from the same coordinate pair.
Calculating Slope
The slope, or rate of change, of a function can be calculated using the following formula: where and are input values, and are output values.Example
If is a linear function and and , find the slope. Is this function increasing or decreasing?Answer: We have been given two input and output values for . corresponds to the coordinate pair and corresponds to the coordinate pair . To find the rate of change, we divide the change in output by the change in input.
We could also write the slope as . The function is increasing because . As noted earlier, the order in which we write the points does not matter when we compute the slope of the line as long as the first output value, or y-coordinate, used corresponds with the first input value, or x-coordinate, used.
Vertical and Horizontal Lines
Vertical and horizontal lines are two special cases of linear equations. Recall that the equation of a vertical line is given aswhere c is a constant. Regardless of the y-value of any point on the line, the x-coordinate of the point will be c. Consider a line containing the following points: , and . First, we will try to find the slope.
Zero in the denominator means that the slope is undefined. As a result, it is impossible to write the vertical line as an equation in the form . Also, recall that a function must have exactly one output for every input. As a result, a vertical line is NOT a function. These points do not define a function because for our input, , we have an infinite number of outputs! Although these points cannot be defined as a function, we can nevertheless plot the points. You can see the line in the graph below. Notice that all of the x-coordinates are the same and we find a vertical line through . The equation of a horizontal line is given as
where c is a constant. The slope of a horizontal line is zero, and for any x-value of a point on the line, the corresponding y-coordinate will be c. Suppose we want to find the equation of a line that contains the following set of points: , and . We can use point-slope form. First, we find the slope using any two points on the line.
The graph is a horizontal line through . Notice that all of the y-coordinates are the same.
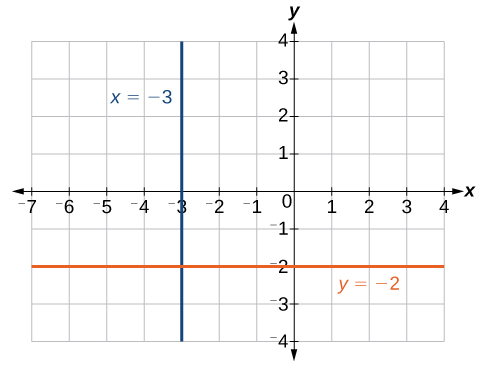 The line is a vertical line. The line is a horizontal line.
Example
Find the equation of the line passing through the given points: and .Answer: The x-coordinate of both points is . Therefore, we have a vertical line, . This line cannot be defined as a function.
Contribute!
Did you have an idea for improving this content? We’d love your input.
