
Characteristics of Graphs of Exponential Functions
Learning Objectives
- Determine whether an exponential function and it's associated graph represents growth or decay
- Sketch a graph of an exponential function
| x | –3 | –2 | –1 | 0 | 1 | 2 | 3 |
| 1 | 2 | 4 | 8 |
- the output values are positive for all values of x;
- as x increases, the output values increase without bound; and
- as x decreases, the output values grow smaller, approaching zero.
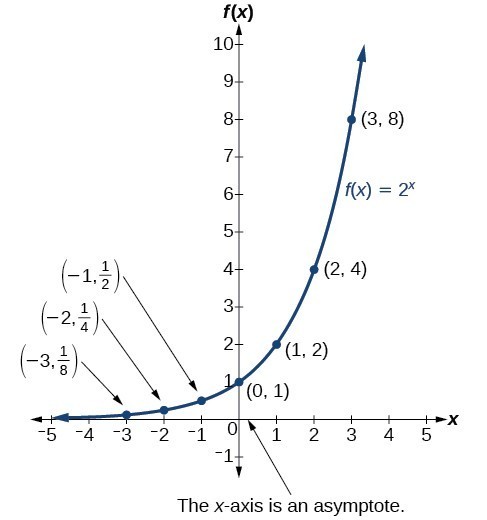 Notice that the graph gets close to the x-axis, but never touches it.
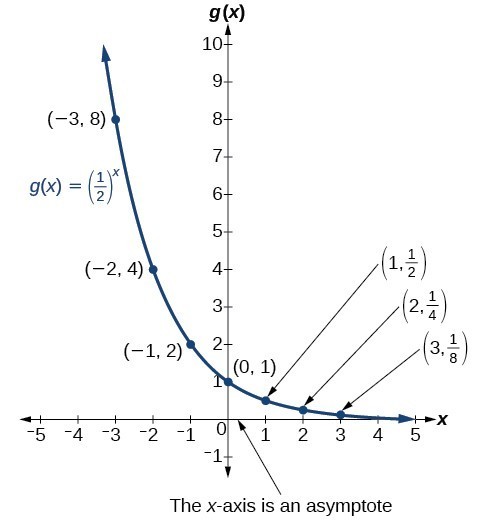
| x | –3 | –2 | –1 | 0 | 1 | 2 | 3 |
| 8 | 4 | 2 | 1 |
- the output values are positive for all values of x;
- as x increases, the output values grow smaller, approaching zero; and
- as x decreases, the output values grow without bound.
 The domain of is all real numbers, the range is , and the horizontal asymptote is .
A General Note: Characteristics of the Graph of the Parent Function f(x) = bx
An exponential function with the form , , , has these characteristics:- one-to-one function
- horizontal asymptote:
- domain:
- range:
- x-intercept: none
- y-intercept:
- increasing if
- decreasing if
How To: Given an exponential function of the form , graph the function by hand.
- Create a table of points.
- Plot at least 3 point from the table, including the y-intercept .
- Draw a smooth curve through the points.
- State the domain, , the range, , and the horizontal asymptote, .
Example: Sketching the Graph of an Exponential Function of the Form f(x) = bx
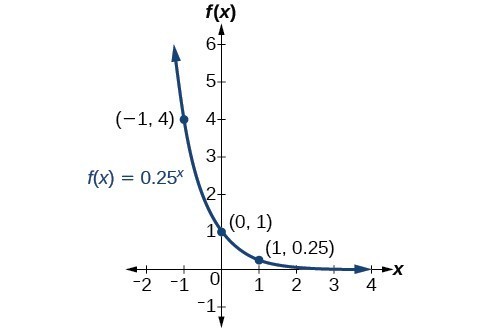
Sketch a graph of . State the domain, range, and asymptote.Answer: Before graphing, identify the behavior and create a table of points for the graph.
- Since b = 0.25 is between zero and one, we know the function is decreasing. The left tail of the graph will increase without bound, and the right tail will approach the asymptote y = 0.
- Create a table of points.
x –3 –2 –1 0 1 2 3 64 16 4 1 0.25 0.0625 0.015625 - Plot the y-intercept, , along with two other points. We can use and .
 The domain is ; the range is ; the horizontal asymptote is .
Try It
Sketch the graph of . State the domain, range, and asymptote.Answer:
The domain is ; the range is ; the horizontal asymptote is .

