We've updated our
Privacy Policy effective December 15. Please read our updated Privacy Policy and tap

Guias de estudo > Intermediate Algebra

Read: Identify a One-to-One Function

Learning Objectives

  • Define one-to-one function
  • Use the horizontal line test to determine whether a function is one-to-one
Remember that in a function, the input value must have one and only one value for the output. There is a name for the set of input values and another name for the set of output values for a function. The set of input values is called the domain of the function. And the set of output values is called the range of the function. In the first example we remind you how to define domain and range using a table of values.

Example

Find the domain and range for the function.

x

y

5−5

6−6

2−2

1−1

1−1

00

00

33

55

1515

Answer: The domain is the set of inputs or x-coordinates.

{5,2,1,0,5}\{−5,−2,−1,0,5\}

The range is the set of outputs of y-coordinates.

{6,1,0,3,15}\{−6,−1,0,3,15\}

Answer

Domain:{5,2,1,0,5}Range:{6,1,0,3,15}\begin{array}{l}\text{Domain}:\{−5,−2,−1,0,5\}\\\text{Range}:\{−6,−1,0,3,15\}\end{array}

In the following video we show another example of finding domain and range from tabular data. https://youtu.be/GPBq18fCEv4 Some functions have a given output value that corresponds to two or more input values. For example, in the following stock chart the stock price was $1000 on five different dates, meaning that there were five different input values that all resulted in the same output value of $1000. Figure of a bull and a graph of market prices.

However, some functions have only one input value for each output value, as well as having only one output for each input. We call these functions one-to-one functions. As an example, consider a school that uses only letter grades and decimal equivalents, as listed in.

Letter grade Grade point average
A 4.04.0
B 3.03.0
C 2.02.0
D 1.01.0

This grading system represents a one-to-one function, because each letter input yields one particular grade point average output and each grade point average corresponds to one input letter.

To visualize this concept, let’s look again at the two simple functions sketched in (a)and (b) of Figure 10.
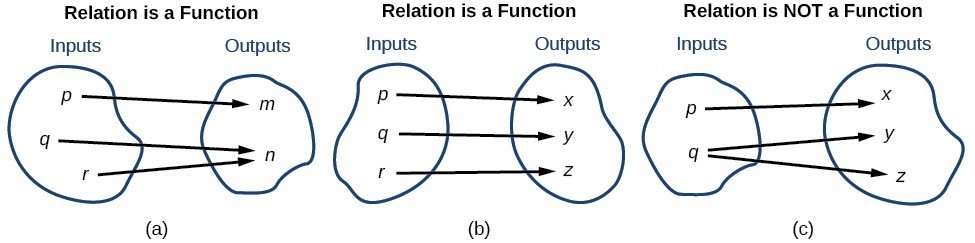
Three relations that demonstrate what constitute a function. Figure 10
The function in part (a) shows a relationship that is not a one-to-one function because inputs qq and rr both give output nn. The function in part (b) shows a relationship that is a one-to-one function because each input is associated with a single output.

A General Note: One-to-One Function

A one-to-one function is a function in which each output value corresponds to exactly one input value.

Example

Which table represents a one-to-one function? a)
input output
11 55
1212 22
00 1-1
44 22
5-5 00
b)
input output
44 88
88 1616
1616 3232
3232 6464
6464 128128
 

Answer: Table a) maps the output value 22 to two different input values, therefore this is NOT a one-to-one function. Table b) maps each output to one unique input, therefore this IS a one-to-one function.

Answer

Table b) is one-to-one

  In the following video, we show an example of using tables of values to determine whether a function is one-to-one. https://youtu.be/QFOJmevha_Y

Using the Horizontal Line Test

An easy way to determine whether a function is a one-to-one function is to use the horizontal line test on the graph of the function.  To do this, draw horizontal lines through the graph. If any horizontal line intersects the graph more than once, then the graph does not represent a one-to-one function.

How To: Given a graph of a function, use the horizontal line test to determine if the graph represents a one-to-one function.

  1. Inspect the graph to see if any horizontal line drawn would intersect the curve more than once.
  2. If there is any such line, determine that the function is not one-to-one.

Exercises

For the following graphs, determine which represent one-to-one functions.
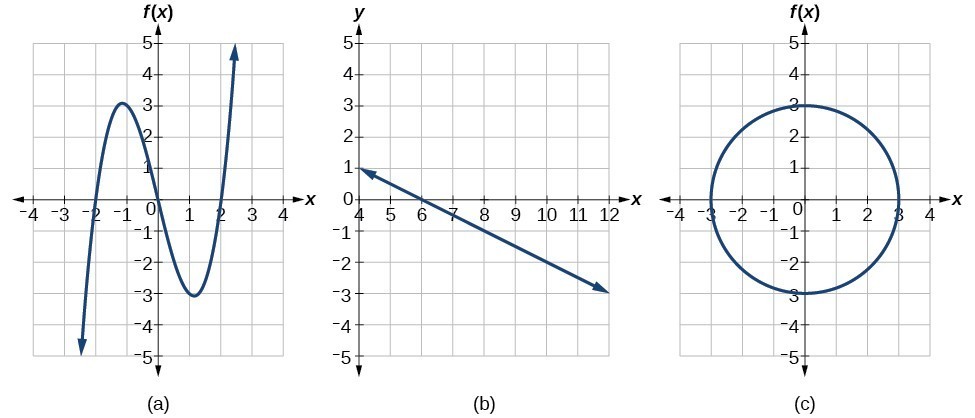
 Graph of a polynomial.

Answer:

The function in (a) is not one-to-one. Using the horizontal line test, as shown below, it intersects the graph of the function at two points (and we can even find horizontal lines that intersect it at three points.)

  The function in (b) is one-to-one. Any horizontal line will intersect a diagonal line at most once. Graph of a line with three dashed horizontal lines passing through it. The function (c) is not one-to-one, and is in fact not a function. Graph of a circle with two dashed lines passing through horizontally  

 
The following video provides another example of using the horizontal line test to determine whether a graph represents a one-to-one function. https://youtu.be/tbSGdcSN8RE

Summary

In real life and in algebra, different variables are often linked. When a change in value of one variable causes a change in the value of another variable, their interaction is called a relation. A relation has an input value which corresponds to an output value. When each input value has one and only one output value, that relation is a function. Functions can be written as ordered pairs, tables, or graphs. The set of input values is called the domain, and the set of output values is called the range.  

Licenses & Attributions